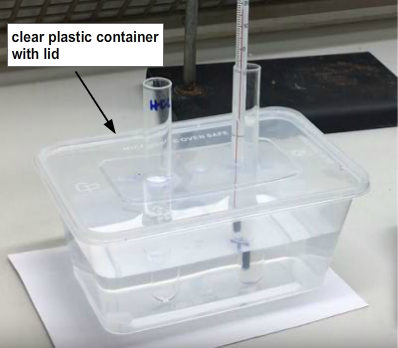
The reaction produces a very fine precipitate of sulfur that makes to solution cloudy so that the black cross gradually disappears when viewed through the test tube.
The rate is found from the time this takes to happen.
Step 1
Use the slider to set the temperature.
Step 2
Click the "Add HCl" button to add 1cm³ of hydrochloric acid to 10cm³ of the sodium thiosulfate solution.
Step 3
Use the reaction time slider to change the reaction time and find the time for the black cross to disappear.
It is quite hard to judge when this occurs, so you should repeat the measurement 2 or 3 times, recording your results in seconds each time.
Step 4
Use the "Reset" button to reset the experiment and then repeat at a new temperature.
The test tubes fit through holes in the lid and this serves to hold them upright.
The temperature is varied by adding hot water (e.g. from a kettle). The reaction time is typically less that 2 minutes, to the temperature of the
reaction will not change much, especially at lower temperatures.
However, to allow for any change record the temperature at the start and end of the reaction and then average.
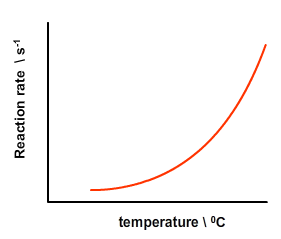
The reaction time t = time for the cross to 'disappear' is a measure of the time to produce a fixed mass of sulfur precipitate at the
various temperatures. The reaction rate is the proportional to 1/t.
Plot a graph of temperature against 1/t.
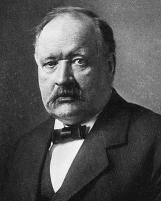
Svante August Arrhenius (1859 – 1927) was a Swedish scientist. Originally a physicist, but often referred to as a chemist,
Arrhenius was one of the founders of the science of physical chemistry. He received the Nobel Prize for Chemistry in 1903,
The Arrhenius equation gives the dependence of the rate constant of a chemical reaction on the absolute temperature.
$$k = {A e^{- { E_a \over RT}}} $$
where
k is the rate constant for the reaction, T is the absolute (kelvin) temperature, Ea is the activation energy for the reaction, R is the universal gas constant, A is a constant specific to the chemical reaction.
Taking natural logarithms of both side of the equations gives
$$ln(k) = A - { E_a \over RT} $$
Since \(k \propto \text {rate of reaction = 1/t} \), the equation above can be written as
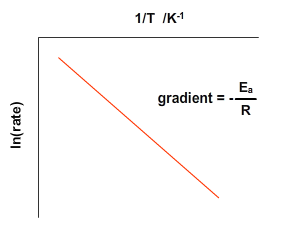
$$ln(rate) = A - { E_a \over RT} $$
Therefore a graph of ln(rate) against 1/T should be a straight line. Use your results to plot a graph like the one shown above. Draw a best fit
straight line, calculate the gradient and hence find a value for the activation energy.